Arise Q2 2024 Preview: Weaker-than-expected spot prices but favourable price hedges

Research Update

2024-07-12

07:00

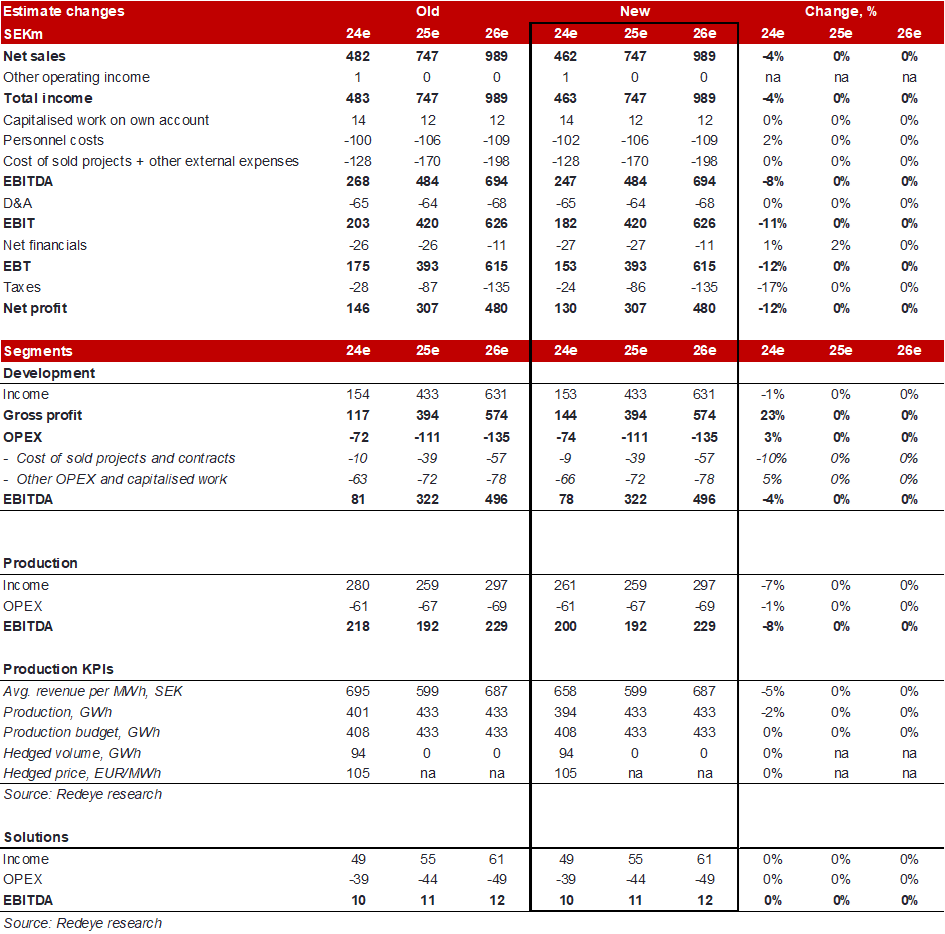
Redeye updates its estimates ahead of Arise’s Q2 report, which is due on 17 July. The quarter showed lower market prices for electricity than expected, which has a negative effect on our Q2 estimates. However, Arise has hedged around 25% of our expected Q2 production at favourable prices, which mutes this negative effect. Furthermore, we expect a significant production contribution from the new wind farm Lebo, as well as revenues from ongoing constructions plus the earn-out payment from the finalised project Ranasjö- and Salsjöhöjden in the development segment. The estimate changes do not affect our fair value range or base case.

ME

Mattias Ehrenborg

Updated production numbers

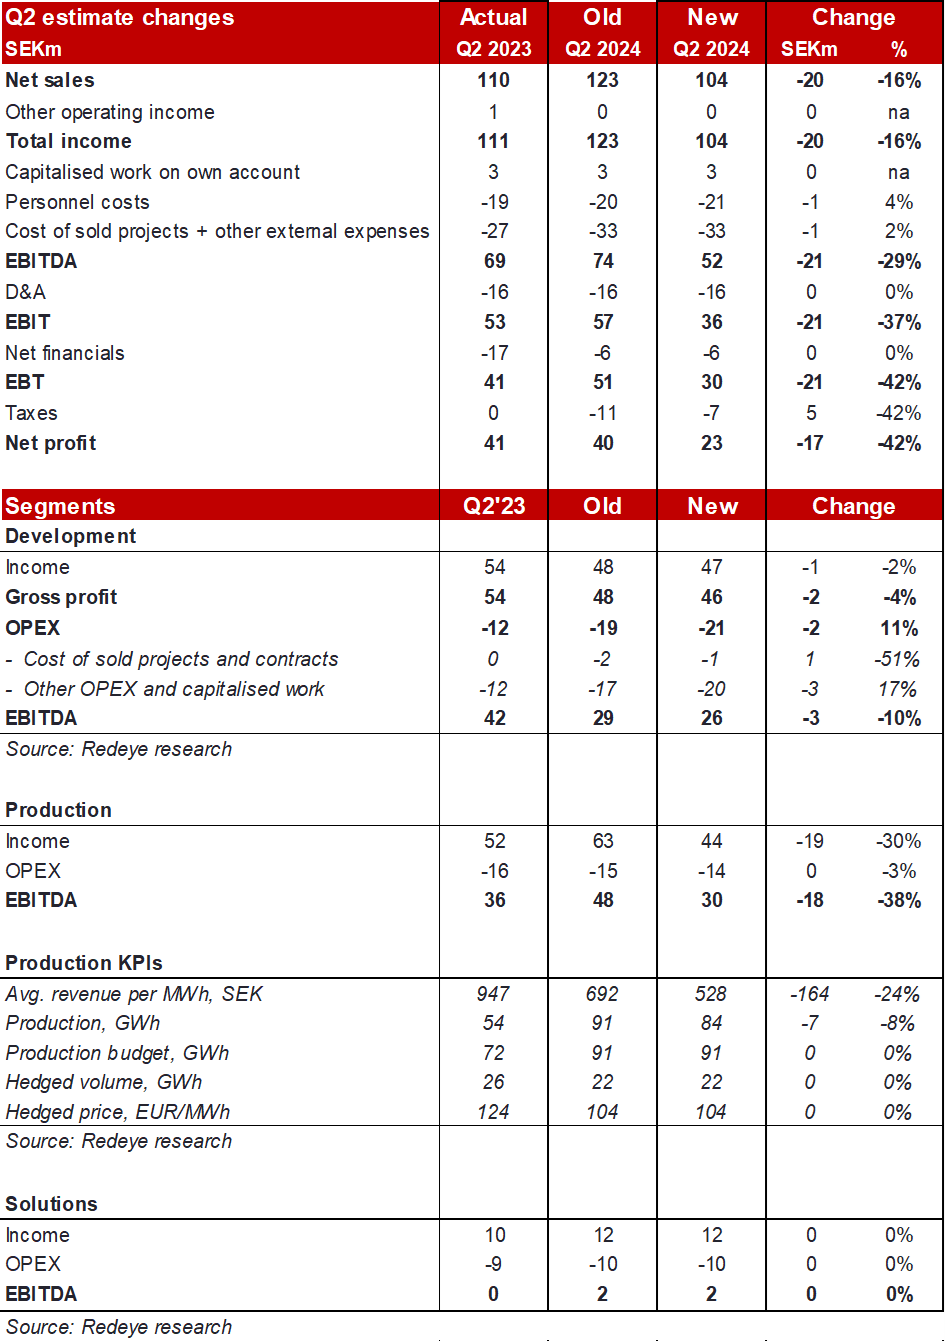
The Q2 2024 winds seem to have been significantly stronger than in Q2 2023 -which, according to our calculations, should generate 68.5GWh in Q2’24 vs 53.9GWh in Q2’23. This compares to the budget of 72.1GWh (also our previous est.). In addition to these numbers, we also expect Lebo (fully operational since May) to contribute with 15GWh in the quarter - bringing the total Q2 production to 83.5GWh (prev. est: 91.0GWh).

Lower-than-expected spot prices

Q2 2024 presented lower-than-expected spot prices in both SE3 and SE4. We previously expected a Q2 SE3 price of EUR45/MWh vs the actual EUR31/MWh. For SE4, we expected a price of EUR60/MWh vs the actual EUR51/MWh. We also expected a capture price discount of 15% - which, according to our calculations, seems to amount to 30% in Q2, negatively impacting our estimates. All in all, our expected realised revenue/MWh is reduced from SEK692/MWh to SEK528/MWh – partly saved by successful price hedges (25% of prod.) made at EUR104/MWh. Without the hedges, we believe Arise would realise a revenue of SEK321/MWh.

Development numbers are driven by ongoing constructions and earn-outs

We expect ongoing constructions to generate SEK19m in revenue recognition and the EUR6.6m earn-out payment for Rana- and Salsjöhöjden to add EUR2.4m to the P&L. We also expect a minor negative FX effect of SEK3m to affect Q2 numbers due to the revaluation of receivables related to ongoing constructions. A reversed effect of SEK9m took place in Q1 2024. Overall, we expect Arise to report a total EBITDA of SEK52m (SEK69m in Q2’23), vs our previous estimate of SEK74m.

Key financials

SEKm202220232024e2025e2026e
Revenues1,169.0507.0463.1747.4989.4
Revenue Growth243%-56.6%-8.7%61.4%32.4%
EBITDA851.0286.0247.1483.9693.8
EBIT790.0222.0181.6419.6626.2
EBIT Margin67.6%43.8%39.2%56.1%63.3%
Net Income772.0205.0129.5306.5479.9
EV/EBITDA2.57.710.34.52.5
EV/EBIT2.69.914.15.12.7

Investment thesis

Case

A Swedish renewable energy producer and developer

Arise is one of Sweden's leading wind power companies regarding project development, construction, and asset management. The company’s own wind power assets have a total capacity of 172MW and annual production of around 433GWh. This provides recurring revenues and strong cash flows. Also, with high electricity prices, the production enjoys good leverage in terms of profitability, given it has a >95% gross margin. We argue there are hidden values in the own wind farms as the book value is based on the depressed electricity price outlook made in 2019, and since the outlook has improved significantly. Project Development is Arise’s primary growth area, and the project portfolio of wind- and solar PV projects is strong. The entire proportionate portfolio is >5GW of which >500MW is in late-stage development. Using historical profit multiples of SEK1m-2m per MW, the gross profit potential lies between SEK5bn-SEK10bn over the coming decade. Furthermore, Arise has nearly SEK1bn in cash which could spur M&A activity (i.e. acquiring project rights or power assets) which could spur further growth.

Evidence

A proven market leader

Arise has a long and solid track record of developing, constructing, and divesting onshore wind power projects and has constructed 8% of Sweden’s total installed wind power capacity by the end of 2022. In 2022, Arise made its largest project divestment to date in the form of Kölvallen (260MW), which generated a record profit of EUR90m, and a cash payment of EUR75m has been received upfront. Arise’s own production produces 343 GWh pa and generates significant cash flow – especially in recent times when electricity prices have increased rapidly. In recent years, financials have improved on the back of successful project divestments and Arise now has a big cash position and should therefore be able to be more opportunistic in terms of M&A and investments in its own additional production.

Challenge

Complex permitting processes, long lead times, and construction risks

We consider Arise’s project development business as the clear growth driver in the coming years. Developing and constructing a project typically takes 5-10 years and is characterised by long lead times and runs the risk of not receiving permits. We consider Arise to have a good track record of bringing projects to the market, but investors should be aware of the risks when assessing the potential project portfolio-value. There is also a risk that cost overruns or delays can erode the profit potential. Arise is typically de-risking construction and earnings risk by structuring deals so it receives an up-front payment + an earn-out if specific conditions are met. The construction risk is then on the investor of the wind farm. We have seen examples where cost overruns, especially since 2020, have eroded the profit potential of projects. There is also a political risk that should not be underestimated, as Political decisions impacts the business conditions for the energy sector at large.

Challenge

Realised electricity prices

High electricity prices are good for Arise. Both for its electricity production, but also for its development business as it increases the profit potential of each wind farm. However, when electricity prices are volatile, and Arise has hedged parts of its production, there is a risk that realised electricity price would be hurt in hours where production is low and not sufficient to cover. Also, in hours where production is high, electricity prices are low, as wind power becomes the dominant production source for the hour –hurting the weighted realised price for a specific time period.

Valuation

Signficant upside potential and limited downside risk

We have a fair value range of SEK22 - SEK110 with a base case of SEK79 per share. Our valuation is based on the value of Arises wind farms and the estimated value of its project portfolio. The main differences between our base, bear and bull cases are the fair value of Arise's own wind farms (Driven by electricity price assumptions) and the gross profit from the project portfolio (driven by MW delivered pa and profit multiple).

Quality Rating

People: 4

The new strategy, with project development and management as the main growth area, has been executed with great success so far. The communication regarding business and financials has improved and our view is that Arise is transparent and balanced in its communication. Management has relevant experience and credibility and some also have significant amounts of Arise-shares. The company culture appears to be dynamic and strong. A few large institutional owners give stability and through Johan Claesson and CA Fastigheter, Arise has a long-term committed and active owner.  

Business: 3

Arise has two business segments: Operation of own wind farms and project development & management. The business conditions for these two are different in many respects. In the own wind farms, there is overall limited possibilities to impact revenues or costs. On a positive note, revenues are repetitive and operations are not dependent on key individuals. However, product differentiation is virtually impossible as electricity is a commodity. Project development is different in these respects. So far Arise has a very good track record with most of its project deals coming out in line with budget. The outlook for both segments is still favorable, with structurally high electricity prices and good profit margins on projects, although electricity prices is a variable that is very difficult to predict.    

Financials: 2

Arise has generated good cash flows but depreciations and amortizations have weighed on earnings. Hence our rating is burdened by historically reported losses. Since 2018 underlying profitability has clearly picked up and key metrics are gradually improving. The balance sheet is now robust as net debt has decreased significantly thanks to strong cash flow generation. Our Financials rating will certainly improve further if Arise delivers approximately in line with our forecasts.   

Financials

Income statement
SEKm202220232024e2025e2026e
Revenues1,169.0507.0463.1747.4989.4
Cost of Revenue0.000.000.000.000.00
Operating Expenses318.0221.0216.0263.5295.6
EBITDA851.0286.0247.1483.9693.8
Depreciation-61.0-65.0-65.4-64.3-67.6
Amortizations-----
EBIT790.0222.0181.6419.6626.2
Shares in Associates-----
Interest Expenses-26.0-62.0-53.6-50.1-11.0
Net Financial Items32.0100.085.673.611.0
EBT772.0205.0153.1393.0615.2
Income Tax Expenses0.000.00-23.6-86.5-135.3
Net Income772.0205.0129.5306.5479.9
Balance sheet
Assets
Non-current assets
SEKm202220232024e2025e2026e
Property, Plant and Equipment (Net)1,164.02,175.82,307.82,378.52,348.9
Goodwill-----
Intangible Assets25.030.030.030.030.0
Right-of-Use Assets-----
Other Non-Current Assets243.0304.3326.0326.0326.0
Total Non-Current Assets1,432.02,510.02,663.82,734.52,704.9
Current assets
SEKm202220232024e2025e2026e
Inventories-----
Accounts Receivable237.0379.8454.0231.0231.0
Other Current Assets26.00.250.000.000.00
Cash Equivalents1,220.0917.0879.41,278.41,219.5
Total Current Assets1,483.01,297.01,333.41,509.41,450.5
Total Assets2,915.03,807.03,997.24,243.94,155.4
Equity and Liabilities
Equity
SEKm202220232024e2025e2026e
Non Controlling Interest-318.5322.2361.2431.0
Shareholder's Equity1,616.01,887.51,943.12,150.72,492.4
Non-current liabilities
SEKm202220232024e2025e2026e
Long Term Debt925.01,074.61,156.01,156.0656.0
Long Term Lease Liabilities-----
Other Non-Current Lease Liabilities117.0350.4362.0362.0362.0
Total Non-Current Liabilities1,042.01,425.01,518.01,518.01,018.0
Current liabilities
SEKm202220232024e2025e2026e
Short Term Debt27.054.056.056.056.0
Short Term Lease Liabilities-----
Accounts Payable-----
Other Current Liabilities231.0122.0158.0158.0158.0
Total Current Liabilities258.0176.0214.0214.0214.0
Total Liabilities and Equity2,916.03,806.93,997.24,243.94,155.4
Cash flow
SEKm202220232024e2025e2026e
Operating Cash Flow923.0223.0182.5608.5546.4
Investing Cash Flow-305.0-538.0-153.3-119.0-22.0
Financing Cash Flow464.011.0-100.8-90.5-583.4

Rating definitions

The team

Disclosures and disclaimers

Premium Plan required to unlock

Unlock companies to access

more high quality research.