Formpipe: Early Signs of Improved Momentum in Private
Research Update
2023-10-26
14:45
Redeye retains its positive view of Formpipe following a Q3 report largely matching our expectations on the most important lines. While Deliveries came in somewhat short of our forecasts, resulting in a lower EBIT, the solid new sales towards banking customers and a more positive take on the ERP market were the quarter's highlights. We lower our Base Case and forecasts slightly.
Momentum in Banking New Sales
While the overall ACV of SEK8.3m (6.2) was solid and in line with our forecasts, the number is a net of strong new sales and higher churn than usual. Typically, high churn is a big negative for SaaS companies. However, in this case it is about two banking customers in financial trouble, which is unrelated to Formpipe’s product offering and customer success. On the positive side, the new sales were strong, including four new banking customers, the highest quarterly intake yet. In addition to the positive momentum within banking, management seems optimistic about an improvement in the ERP segment in the near-to-mid-term as well.
Softer DK Deliveries Hurt EBIT
Total sales came in short of our forecast of SEK131m and amounted to SEK124m (117), corresponding to 5% growth y/y. As expected, the y/y growth was mainly driven by S&M and SaaS, following the strong ARR growth (ACV) during 2022 and early 2023. Recurring revenue, S&M and SaaS, grew by 23% y/y, which matched our expectations. The deviation was largely due to lower Deliveries in Public DK. Adjusted EBIT was SEK13.1m, corresponding to an adjusted EBIT margin of 10.5% (adjusted for SEK1.5m in severance pay to exiting CEO). Our forecast was SEK15.1m and 11.6% and did not include any one-offs. The lower EBIT than we expected resulted from the lower sales, due to less Deliveries in Public DK than we expected, while OPEX was roughly in line with our expectations. Nevertheless, Formpipe continues to improve its margins, gradually moving towards its 20% EBIT margin target for 2025.
New Base Case SEK33 (35)
We lowered our Base Case to SEK33 (35) mainly because we increased our risk-free rate in the WACC from 2.5% to 3% following increased 10-year market rates. However, a slight decrease in EBIT forecasts also has a minor negative effect. We reduced our EBIT forecasts for 2023-2024 by 4%, largely due to lowered Deliveries forecasts. Nevertheless, with solid cost control and solid ACV – implying robust future growth in recurring revenues – we believe the investment case, where margin expansion is key, is intact.
Key financials
| SEKm | 2022 | 2023e | 2024e | 2025e | 2026e |
| Revenues | 485.1 | 526.8 | 568.6 | 622.5 | 672.7 |
| Revenue Growth | 2.5% | 8.6% | 7.9% | 9.5% | 8.1% |
| EBIT | 15.8 | 49.9 | 87.7 | 121.0 | 147.5 |
| EBIT Margin | 3.3% | 9.5% | 15.4% | 19.4% | 21.9% |
| EV/Revenue | 2.5 | 2.6 | 2.3 | 1.9 | 1.6 |
| EV/EBIT | 77.9 | 27.3 | 14.6 | 9.8 | 7.3 |
| ARR | 369 | 420 | 464 | 508 | 552 |
| ARR Growth | 20.5% | 13.6% | 10.5% | 9.5% | 8.7% |
| EBITDA - CAPEX | 10.8 | 61.7 | 96.2 | 119.3 | 141.1 |
| EBITDA - CAPEX Margin | 2.6% | 13.3% | 19.1% | 21.7% | 23.7% |
| EV/ARR | 3.3 | 3.2 | 2.8 | 2.3 | 1.9 |
| EV/EBITDA - CAPEX | 113.97 | 22.10 | 13.34 | 9.93 | 7.58 |
| Net Debt | 39.4 | 7.7 | -72.2 | -171.3 | -285.9 |
| NWC/R12mSales | -26.5% | -25.0% | -25.0% | -25.0% | -25.0% |
Review of Q3 2023
| Estmates vs. Actuals | ||||||
| Sales | Q3E 2023 | Q3A 2023 | Diff | Q3A 2022 | Q2A 2023 | |
| Net Sales | 131.1 | 123.8 | -6% | 117.4 | 137.5 | |
| Y/Y Growth (%) | 12% | 5% | -18% | -4% | ||
| Support & Maintenance | 64.7 | 65.5 | 1% | 56.4 | 62.3 | |
| Growth y/y | 15% | 16% | 7% | 18% | ||
| ARR (S&M) | 259.2 | 254.1 | -2% | 231.4 | 258.2 | |
| ACV (S&M) | 1.0 | -1.0 | -200% | -0.8 | 2.0 | |
| SaaS | 35.1 | 33.7 | -4% | 24.5 | 32.1 | |
| Growth y/y | 43% | 38% | 58% | 108% | ||
| ARR (SaaS) | 155.4 | 154.4 | -1% | 114.0 | 147.4 | |
| ACV (SaaS) | 8.0 | 9.3 | 16% | 7.0 | 8.9 | |
| Licenses | 3.3 | 1.9 | -41% | 3.4 | 7.9 | |
| Growth y/y | -5% | -44% | -93% | -83% | ||
| Deliveries | 28.1 | 22.8 | -19% | 33.1 | 35.1 | |
| Growth y/y | -15% | -31% | 23% | 30% | ||
| OPEX | ||||||
| Cost of revenues | -16.1 | -14.2 | -12% | -16.9 | -16.3 | |
| % of sales | -12% | -12% | -14% | -12% | ||
| Other external costs | -27.8 | -28.5 | 2% | -28.1 | -30.5 | |
| Y/Y Growth (%) | -1% | 1% | 25% | 35% | ||
| Personnel expenses | -66.6 | -65.3 | -2% | -65.0 | -75.3 | |
| Y/Y Growth (%) | 2% | 1% | 1% | 17% | ||
| Earnings | ||||||
| EBIT | 15.1 | 11.6 | -24% | 6.2 | 12.9 | |
| EBIT Margin (%) | 11.6% | 9.4% | 5.3% | 9.4% | ||
| Diluted EPS | 0.21 | 0.16 | -25% | 0.06 | 0.09 |
ARR: Solid New Sales to the Banking Sector
The total ARR (S&M and SaaS) was SEK409m (339m), up from SEK406m in the last quarter. While the q/q growth looks weak, note that FX negatively affected SEK5.5m q/q. The total FX-adjusted ACV was SEK8.3, largely matching our forecast of SEK9m and an improvement compared to last year’s SEK6.2m.
The gross ACV was an impressive SEK16m (10), boosted by an agreement with The Swedish Transport Agency and four new banking customers, the highest intake within banking seen so far. On the other hand, the churn was also higher than usual at SEK-7m due to two larger contracts being terminated by banks in financial trouble. According to management, the record-high intake of the four new banking customers is a better indicator of the underlying development and interest for Lasernet within the banking industry.
Overall, we get the impression that management has a more positive outlook for Private ACV relative to the number seen in the quarter, which is not weak but probably below the potential growth level. In addition to the momentum in the banking sector, there are indications of some improvements in the ERP segment, primarily Microsoft Dynamics in Formpipe’s case. However, sales cycles remain longer – something we hear from basically every SaaS company. Also, based on the comments from the new CEO following a visit to the Dynamics Communities Community Summit last week, we note that Lasernet remains one of few Input/output solutions focusing on Dynamics. The offering is strong, and the challenge is instead to increase awareness among Dynamics users and prospects further.
While Public SE had small numbers regarding both S&M and SaaS ACV, Public DK had strong SaaS but soft S&M, which could indicate accelerating churn and new sales. However, according to management, the deviation is related to expansion sales, where customers are moving from S&M to SaaS. In our view, that is a much better signal than accelerating churn on S&M customers.

Source: Formpipe

Source: Formpipe
The ARR, both S&M and SaaS, and its growth rate (ACV) is the most important metric to follow in Formpipe. The ARR is a leading indicator of recurring revenue growth, the major driver of profit growth in Formpipe and essential to the investment case.
Sales: Lower Deliveries in Denmark Than Expected
Total sales came in short of our forecast of SEK131m and amounted to SEK124m (117), corresponding to 5% growth y/y. As expected, the y/y growth was mainly driven by S&M and SaaS, following the strong ARR growth (ACV) during 2022 and early 2023. Recurring revenue, S&M and SaaS, grew by 23% y/y, which matched our expectations. The deviation was due to lower Deliveries in Public DK and, to some degree, because of lower Licenses (which was a mere SEK1.9m (3.4) in Q3) compared to our expectations.
Total Deliveries declined y/y by 31%. Deliveries in Private are coming down as Formpipe wants partners to take care of the delivery in the Private segment, and, thus, that is nothing we are worried about. The decline in Private was roughly as we anticipated.
For Sweden, Deliveries was up by 10% y/y, as we forecasted. Management is satisfied with the reorganization from relying on partners for sales and implementation to relying on in-house capacity and subcontracting. However, at the same time, it points out that we have not seen any major effect of the transition in the numbers so far.
We will discuss our view of the pros and cons with partners versus in-house and which strategy suits what markets in our SaaS Update Q3 2023 (expected to be published in late November). In short, we believe a local market with a rather small TAM, like the Swedish public sector, is best served with in-house resources, in line with Formpipe’s new strategy.
As mentioned, the miss relative to our forecasts was related to Public DK. While we expected a decline y/y due to some revenue in the Landburgsstyrelsen moving from Deliveries to S&M, the decrease was larger. However, our impression is that Public DK had a softer overall Q3 in terms of Deliveries, and thus, we do not cut our forecasts for DK Deliveries significantly.

Source: Formpipe
Formpipe has four kinds of sales: Support & Maintenance (S&M), SaaS, Licenses and Deliveries. Support & Maintenance relates to service agreements for software sold as an on-premises license and SaaS add-on modules where the platform was initially sold as an on-premises license. The Support & Maintenance revenue is 100% recurring and largely resembles SaaS revenue with high gross margins. SaaS revenue is 100% recurring software revenue from software sold as a subscription with high gross margins. Licenses constitute on-premises licenses, and their share of total sales is low and declining. Deliveries is revenue from consulting or professional service with lower gross margins, where Formpipe integrates and sometimes customizes the software.
OPEX: Marginally Below Expectations
Overall, OPEX came in below our forecast of SEK111m and was SEK108m (110). There was no major deviation in the specific cost items. However, the number of employees decreased by eight q/q while we expected a net add of two, which, naturally, all else equal, lowers our OPEX forecasts.
According to management, the net reduction of eight employees q/q is mainly related to the Danish business following the lowered volumes from Landburgsstyrelsen. We expect Formpipe to have a slight net increase in the number of employees over the next few quarters, mainly related to the Swedish deliveries organization.

Source: Formpipe
Sales expenses relate mainly to partner kickbacks and sub-consultants. In addition to the typical Other costs, like rent, software and travel, the line includes Formpipe’s Ukrainian-based offshore resources.
Profit and Cash Flow: Solid y/y Improvement
Adjusted EBIT was SEK13.1m, corresponding to an adjusted EBIT margin of 10.5% (adjusted for SEK1.5m in severance pay to exiting CEO). Our forecast was SEK15.1m and 11.6% and did not include any one-offs. While the margin improved both y/y and q/q, in line with management’s target of gradually improving towards 20% in 2025, we expected a slightly higher level. The lower EBIT than we expected resulted from the lower sales, due to less Deliveries in Public DK than we expected, while OPEX was roughly in line with our expectations.
EBITDA - CAPEX was SEK15.7m (-0.9), corresponding to an EBITDA - CAPEX margin of 12.7% (-0.7), somewhat below our forecast of SEK18.4m. Thus, also for this earnings metric, the trend towards higher margins and profitability is clear, although coming somewhat short of expectations in this quarter.
By the end of the quarter, Formpipe’s net debt was SEK35m, equal to 0.3x EBITDA 2023e.

Source: Formpipe
As for any SaaS business capitalizing R&D, EBITDA and EBITDA margin are unsuitable metrics for Formpipe. This, as EBITDA discards a large portion of the company’s R&D costs totally. R&D is typically a high cost for most SaaS businesses. Instead, EBIT (where the capitalized R&D is amortized over time) or EBITDA – capitalized R&D/EBITDA – capex are better measures of the underlying profitability as it concerns the company’s full R&D spend.
Estimate Revisions: Minor Revisions
We lowered our sales forecasts by 2-4% for 2023-2024, which, combined with a slight cut on OPEX, resulted in a 4% reduction of our EBIT forecasts for 2023-2024.
Notable changes:
- We lower our expectations on Deliveries somewhat. The slight cut is related to us expecting somewhat lower Deliveries from Public DK and from Private as the transformation to partner-led deliveries continues.
- Considering the net reduction of eight employees, we lowered our personnel costs forecasts. That is mainly affecting 2024.
- We moved some ACV from S&M to SaaS, as we see a migration in some customer segments.
| Estimate Revisions | ||||||
| Sales | FYE 2023 | Old | Change | FYE 2024 | Old | Change |
| Net Sales | 526.8 | 537.3 | -2% | 568.6 | 589.9 | -4% |
| Y/Y Growth (%) | 9% | 11% | 8% | 10% | ||
| Support & Maintenance | 251.7 | 252.2 | 0% | 259.1 | 264.2 | -2% |
| Growth y/y | 11% | 11% | 3% | 5% | ||
| ARR (S&M) | 256.1 | 261.2 | -2% | 262.1 | 267.2 | -2% |
| ACV (S&M) | 6.3 | 8.3 | -24% | 6.0 | 6.0 | 0% |
| SaaS | 129.8 | 133.2 | -3% | 172.8 | 173.4 | 0% |
| Growth y/y | 38% | 42% | 33% | 30% | ||
| ARR (SaaS) | 163.4 | 164.4 | -1% | 201.4 | 200.4 | 0% |
| ACV (SaaS) | 34.6 | 33.3 | 4% | 38.0 | 36.0 | 6% |
| Licenses | 17.6 | 18.9 | -7% | 12.9 | 13.9 | -8% |
| Growth y/y | 6% | 14% | -27% | -26% | ||
| Deliveries | 127.7 | 133.0 | -4% | 123.9 | 138.3 | -10% |
| Growth y/y | -14% | -10% | -3% | 4% | ||
| OPEX | ||||||
| Cost of revenues | -62.4 | -65.7 | -5% | -65.4 | -70.8 | -8% |
| % of sales | 12% | 12% | 12% | 12% | ||
| Other external costs | -116.3 | -115.6 | 1% | -118.9 | -117.9 | 1% |
| Y/Y Growth (%) | -1% | -1% | 2% | 2% | ||
| Personnel expenses | -283.2 | -288.2 | -2% | -278.9 | -294.8 | -5% |
| Y/Y Growth (%) | 0% | 2% | -2% | 2% | ||
| Earnings | ||||||
| EBIT | 49.9 | 52.0 | -4% | 87.7 | 91.4 | -4% |
| EBIT Margin (%) | 9.5% | 9.7% | 15.4% | 15.5% | ||
| Diluted EPS | 0.66 | 0.74 | -11% | 1.26 | 1.31 | -4% |
| Forecasts | ||||||||
| Sales | Q1A 2023 | Q2A 2023 | Q3A 2023 | Q4E 2023 | FYE 2023 | FYE 2024 | FYE 2025 | FYE 2026 |
| Net Sales | 127.6 | 137.5 | 123.8 | 137.8 | 526.8 | 568.6 | 622.5 | 672.7 |
| Y/Y Growth (%) | 6% | 15% | 5% | 8% | 9% | 8% | 9% | 8% |
| Support & Maintenance | 60.1 | 62.3 | 65.5 | 63.8 | 251.7 | 259.1 | 265.1 | 271.1 |
| Growth y/y | 8% | 11% | 16% | 10% | 11% | 3% | 2% | 2% |
| ARR (S&M) | 249.2 | 258.2 | 254.1 | 256.1 | 256.1 | 262.1 | 268.1 | 274.1 |
| ACV (S&M) | 3.3 | 2.0 | -1.0 | 2.0 | 6.3 | 6.0 | 6.0 | 6.0 |
| SaaS | 28.1 | 32.1 | 33.7 | 35.8 | 129.8 | 172.8 | 214.7 | 252.7 |
| Growth y/y | 35% | 45% | 38% | 37% | 38% | 33% | 24% | 18% |
| ARR (SaaS) | 133.5 | 147.4 | 154.4 | 163.4 | 163.4 | 201.4 | 239.4 | 277.4 |
| ACV (SaaS) | 7.4 | 8.9 | 9.3 | 9.0 | 34.6 | 38.0 | 38.0 | 38.0 |
| Licenses | 2.8 | 7.9 | 1.9 | 4.9 | 17.6 | 12.9 | 12.6 | 12.4 |
| Growth y/y | -23% | 225% | -44% | -30% | 6% | -27% | -2% | -2% |
| Deliveries | 36.6 | 35.1 | 22.8 | 33.3 | 127.7 | 123.9 | 130.1 | 136.6 |
| Growth y/y | -9% | -10% | -31% | -8% | -14% | -3% | 5% | 5% |
| OPEX | ||||||||
| Cost of revenues | -15.9 | -16.3 | -14.2 | -15.9 | -62.4 | -65.4 | -71.6 | -77.4 |
| % of sales | -12% | -12% | -12% | -12% | -12% | -12% | -12% | -12% |
| Other external costs | -27.7 | -30.5 | -28.5 | -29.7 | -116.3 | -118.9 | -124.0 | -128.5 |
| Y/Y Growth (%) | 2% | -1% | 1% | -5% | -1% | 2% | 4% | 4% |
| Personnel expenses | -73.4 | -75.3 | -65.3 | -69.2 | -283.2 | -278.9 | -293.2 | -308.8 |
| Y/Y Growth (%) | 2% | 5% | 1% | -6% | 0% | -2% | 5% | 5% |
| Earnings | ||||||||
| EBITDA ex CAPEX | 10.2 | 14.5 | 15.7 | 21.3 | 61.7 | 96.2 | 119.3 | 141.1 |
| EBITDA ex CAPEX Margin | 8.0% | 10.5% | 12.7% | 15.5% | 11.7% | 16.9% | 19.2% | 21.0% |
| EBIT | 7.1 | 12.9 | 11.6 | 17.2 | 49.9 | 87.7 | 121.0 | 147.5 |
| EBIT Margin (%) | 5.5% | 9.4% | 9.4% | 12.5% | 9.5% | 15.4% | 19.4% | 21.9% |
| Diluted EPS | 0.09 | 0.09 | 0.16 | 0.25 | 0.66 | 1.26 | 1.75 | 2.14 |
Valuation
We lowered our Base Case to SEK33 (35) following a Q3 report roughly aligned with our expectations. ACV remains healthy, and the expected margin expansion took another step forward in the quarter, although to a somewhat lower extent than we anticipated. On the other hand, the management’s ACV outlook in the Private segment was more optimistic than we expected. We believe strong growth in recurring revenue fueled by strong ACV in 2022 and continuing momentum in ACV during 2023, along with margin expansion, will provide solid profit growth over the next few years.
The slight decline in Base Case is mainly due to us increasing our risk-free rate in the WACC from 2.5% to 3%, following increased 10-year market rates. However, a slight decrease in EBIT forecasts also has a minor negative effect.
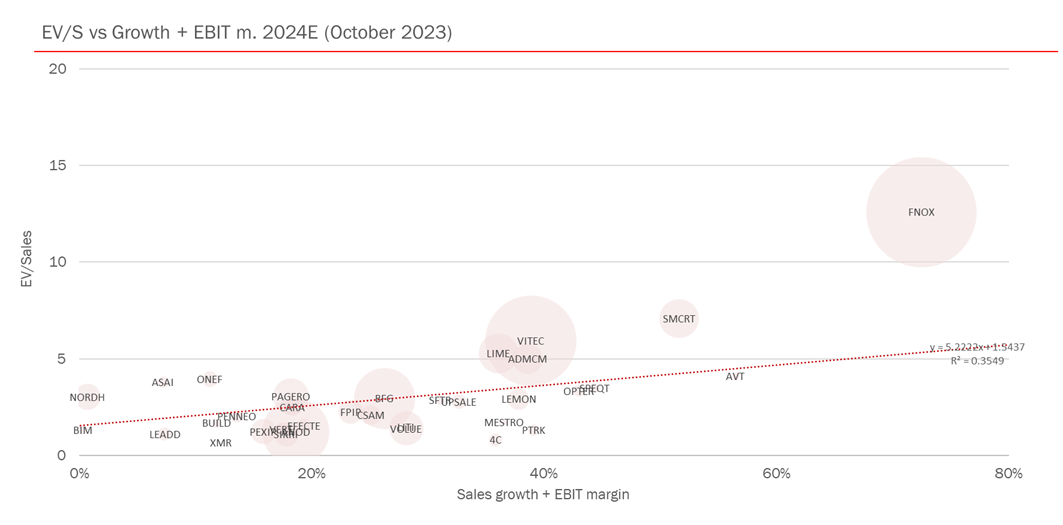
Peer Valuation
While Formpipe does not look very attractive on EV/EBIT multiples 2022-2023, as Formpipe focuses on While Formpipe does not look very attractive on EV/EBIT multiples 2023, as Formpipe focuses on growth, investors should focus on EV/Sales. We believe the combination of a rather low EV/sales, decent sales growth potential, and solid margin expansion potential make Formpipe interesting. The 2025 EV/EBIT of 10x hints at where the expected margin improvement and decent sales growth make with the EV/EBIT valuation. Also, considering that we believe Formpipe can reach an EBIT margin of almost 20% (19.4) in 2025, the 2023e EV/S of 2.6x is arguably attractive given the company reaches our forecasts or its 20% EBIT margin target.

Investment thesis
Case
Margins to Increase as Private Sector Initiatives Pays Off
Evidence
Substantial Improvements in SaaS Growth Suggest Efficient Investments
Challenge
Limited Growth Compared to Average SaaS Business
Challenge
Diversification or Diworsification?
Valuation
Fair Value SEK 33
Quality Rating
People: 4
The new CEO Magnus Svenningson has vast experience in international sales of software as well as working towards both the private and public sectors. Our first impression is that Svenningson seems to fit the needs of Formpipe well, considering his experiences. CFO Joakim Alfredson have relatively high holdings in the firm's stock and most major shareholders are active in the board. The company also has several institutions among its major shareholders.
Business: 4
Formpipe Software's market seems stable with underlying growth. Customers are mainly from the public sector and a big part of revenues are recurring, which creates stability in the business model. Recently, Formpipe has had success with its Lasernet product within the private sector. Unlike the Swedish and Danish public sector, the private sector is global, making the potential much greater.
Financials: 3
Formpipe has non-cyclical recurring revenue streams and a solid financial position. The margins have improved in recent years and are now at robust levels, independent of large License deals. Formpipe is now focusing on growth, and so far, the strategy seems to play out very well.
Financials
| Income statement | |||||
| SEKm | 2022 | 2023e | 2024e | 2025e | 2026e |
| Revenues | 485.1 | 526.8 | 568.6 | 622.5 | 672.7 |
| Cost of Revenue | 67.3 | 62.4 | 65.4 | 71.6 | 77.4 |
| Operating Expenses | 345.4 | 347.2 | 347.6 | 364.4 | 381.7 |
| EBITDA | 72.4 | 117.2 | 155.7 | 186.5 | 213.7 |
| Depreciation | 3.2 | 6.1 | 6.9 | 3.2 | 0.00 |
| Amortizations | 45.6 | 52.3 | 53.7 | 54.9 | 58.9 |
| EBIT | 15.8 | 49.9 | 87.7 | 121.0 | 147.5 |
| Shares in Associates | 0.00 | 0.00 | 0.00 | 0.00 | 0.00 |
| Interest Expenses | -2.2 | -2.4 | -1.7 | -1.7 | -1.7 |
| Net Financial Items | 0.04 | 2.4 | 1.7 | 1.7 | 1.7 |
| EBT | 11.4 | 47.5 | 86.0 | 119.4 | 145.8 |
| Income Tax Expenses | -2.5 | -11.9 | -17.7 | -24.6 | -30.0 |
| Net Income | 8.8 | 35.6 | 68.3 | 94.8 | 115.8 |
| Balance sheet | |||||
| Assets | |||||
| Non-current assets | |||||
| SEKm | 2022 | 2023e | 2024e | 2025e | 2026e |
| Property, Plant and Equipment (Net) | 4.5 | 10.1 | 3.2 | 0.00 | 0.00 |
| Goodwill | 444.6 | 453.8 | 453.8 | 453.8 | 453.8 |
| Intangible Assets | 167.7 | 165.9 | 171.7 | 184.0 | 197.7 |
| Right-of-Use Assets | 14.7 | 9.7 | 9.7 | 9.7 | 9.7 |
| Other Non-Current Assets | 8.1 | 9.4 | 9.4 | 9.4 | 9.4 |
| Total Non-Current Assets | 639.7 | 648.8 | 647.7 | 656.8 | 670.6 |
| Current assets | |||||
| SEKm | 2022 | 2023e | 2024e | 2025e | 2026e |
| Inventories | 0.00 | 0.00 | 0.00 | 0.00 | 0.00 |
| Accounts Receivable | 138.1 | 137.0 | 147.8 | 161.8 | 174.9 |
| Other Current Assets | 0.00 | 0.00 | 0.00 | 0.00 | 0.00 |
| Cash Equivalents | 4.8 | 27.5 | 107.4 | 206.5 | 321.0 |
| Total Current Assets | 142.9 | 164.4 | 255.2 | 368.3 | 495.9 |
| Total Assets | 782.5 | 813.2 | 902.9 | 1,025.1 | 1,166.5 |
| Equity and Liabilities | |||||
| Equity | |||||
| SEKm | 2022 | 2023e | 2024e | 2025e | 2026e |
| Non Controlling Interest | 0.00 | 0.00 | 0.00 | 0.00 | 0.00 |
| Shareholder's Equity | 442.0 | 489.1 | 557.4 | 652.2 | 768.0 |
| Non-current liabilities | |||||
| SEKm | 2022 | 2023e | 2024e | 2025e | 2026e |
| Long Term Debt | 44.2 | 35.1 | 35.1 | 35.1 | 35.1 |
| Long Term Lease Liabilities | 0.00 | 0.00 | 0.00 | 0.00 | 0.00 |
| Other Non-Current Lease Liabilities | 29.4 | 20.3 | 20.3 | 20.3 | 20.3 |
| Total Non-Current Liabilities | 73.6 | 55.5 | 55.5 | 55.5 | 55.5 |
| Current liabilities | |||||
| SEKm | 2022 | 2023e | 2024e | 2025e | 2026e |
| Short Term Debt | 0.00 | 0.00 | 0.00 | 0.00 | 0.00 |
| Short Term Lease Liabilities | 0.00 | 0.00 | 0.00 | 0.00 | 0.00 |
| Accounts Payable | 266.9 | 268.7 | 290.0 | 317.5 | 343.1 |
| Other Current Liabilities | 0.00 | 0.00 | 0.00 | 0.00 | 0.00 |
| Total Current Liabilities | 266.9 | 268.7 | 290.0 | 317.5 | 343.1 |
| Total Liabilities and Equity | 782.5 | 813.2 | 902.9 | 1,025.1 | 1,166.5 |
| Cash flow | |||||
| SEKm | 2022 | 2023e | 2024e | 2025e | 2026e |
| Operating Cash Flow | 80.7 | 79.6 | 146.7 | 173.7 | 194.6 |
| Investing Cash Flow | -92.8 | -55.5 | -59.5 | -67.2 | -72.7 |
| Financing Cash Flow | -6.3 | -5.5 | -7.4 | -7.4 | -7.4 |
Rating definitions
The team
Disclosures and disclaimers
Contents
Review of Q3 2023
ARR: Solid New Sales to the Banking Sector
Sales: Lower Deliveries in Denmark Than Expected
OPEX: Marginally Below Expectations
Profit and Cash Flow: Solid y/y Improvement
Estimate Revisions: Minor Revisions
Valuation
Investment thesis
Quality Rating
Financials
Rating definitions
The team
Download article