Formpipe: Further Improvements in Margins
Research Update
2024-02-20
06:45
Redeye retains its positive view of Formpipe following a Q4 report largely matching our expectations. While lowering our short- and mid-term forecasts somewhat, we find management’s positive outlook and initiatives for improved growth encouraging.
FN
TO
Fredrik Nilsson
Tomas Otterbeck
Contents
Review of Q4 2023
ARR: Negative Effect from FX, Underlying Number Slightly Below Expectations
Sales: Matching Our Forecasts
OPEX: Slightly Above Expectations
Profit and Cash Flow: Further Improvements y/y
Estimate Revisions: Slight EBIT Cuts
Valuation
Investment thesis
Quality Rating
Financials
Rating definitions
The team
Download article
FX Hurting ARR, Solid Underlying Growth
Total sales matched our forecast and grew by 7% y/y. While the important recurring revenue (S&M and SaaS) beat our forecasts slightly, Deliveries came in somewhat short. Headline ARR was lower than expected for both S&M and SaaS. However, that was due to FX revaluations following the stronger SEK. The underlying q/q organic growth in ARR of SEK9m was slightly below our forecast of SEK11m. EBIT matched our forecast at SEK17.3m (5.7), corresponding to an EBIT margin of 12.7% (4.5), constituting a significant y/y increase. Nevertheless, although somewhat higher capitalizations of R&D compensated for the slightly higher OPEX than expected, Formpipe continues to improve its margin as it increases sales at limited increases in OPEX, in line with its financial target.
New Initiatives for Growth
In addition to seeing higher activity in the private sector, management sees potential to strengthen the Lasernet offering and allow for more of a land- and expand-strategy. Today, Lasernet has a strong value proposition, especially to large high-end customers, and management aims to increase its attractiveness to a broader group of potential customers. However, those initiatives are in an early stage, and we do not expect any impact on ARR figures in the short term. Regarding Public, by the start of 2024, Formpipe merged Public SE and DK into one public segment. Management sees many advantages of the merger, such as size, synergies, and focus, and highlights that the business logic is the same across national borders.
Base Case Unchanged at SEK33 (33)
We leave our Base Case at SEK33 (33) despite somewhat lowering our short- and mid-term forecasts. We believe strong growth in recurring revenue fueled by strong ACV, along with margin expansion, will provide solid profit growth over the next few years. We believe the combination of low EV/sales, decent sales growth potential, and solid margin expansion potential makes Formpipe interesting.
Key financials
| SEKm | 2023 | 2024e | 2025e | 2026e | 2027e |
| Revenues | 525.2 | 546.8 | 606.6 | 657.2 | 703.2 |
| Revenue Growth | 8.3% | 4.1% | 10.9% | 8.4% | 7.0% |
| EBIT | 48.8 | 80.0 | 116.6 | 142.2 | 163.2 |
| EBIT Margin | 9.3% | 14.6% | 19.2% | 21.6% | 23.2% |
| EV/Revenue | 2.7 | 2.8 | 2.4 | 2.0 | 1.7 |
| EV/EBIT | 29.5 | 19.1 | 12.3 | 9.3 | 7.3 |
| ARR | 405 | 450 | 495 | 538 | 578 |
| ARR Growth | 9.7% | 11.1% | 10.0% | 8.7% | 7.4% |
| EBITDA - CAPEX | 55.6 | 85.6 | 115.2 | 138.3 | 158.0 |
| EBITDA - CAPEX Margin | 12.0% | 17.6% | 21.4% | 23.7% | 25.3% |
| EV/ARR | 3.6 | 3.4 | 2.9 | 2.4 | 2.1 |
| EV/EBITDA - CAPEX | 25.95 | 17.83 | 12.41 | 9.52 | 7.53 |
| Net Debt | -27.2 | -79.3 | -176.0 | -288.4 | -414.9 |
| NWC/R12mSales | -27.5% | -25.0% | -25.0% | -25.0% | -25.0% |
Review of Q4 2023
| Estmates vs. Actuals | ||||||
| Sales | Q4E 2023 | Q4A 2023 | Diff | Q4A 2022 | Q3A 2023 | |
| Net Sales | 137.8 | 136.2 | -1% | 127.8 | 123.8 | |
| Y/Y Growth (%) | 8% | 7% | 20% | 16% | ||
| Support & Maintenance | 63.8 | 64.9 | 2% | 58.2 | 65.5 | |
| Growth y/y | 10% | 11% | 9% | 23% | ||
| ARR (S&M) | 256.1 | 245.6 | -4% | 244.3 | 254.1 | |
| ACV (S&M) | 2.0 | -1.8 | -190% | 12.8 | -1.0 | |
| SaaS | 35.8 | 36.1 | 1% | 26.3 | 33.7 | |
| Growth y/y | 37% | 37% | 54% | 98% | ||
| ARR (SaaS) | 163.4 | 159.6 | -2% | 125.0 | 154.4 | |
| ACV (SaaS) | 9.0 | 11.0 | 22% | 11.0 | 9.3 | |
| Licenses | 4.9 | 6.1 | 24% | 7.0 | 1.9 | |
| Growth y/y | -30% | -13% | 33% | -63% | ||
| Deliveries | 33.3 | 29.2 | -12% | 36.3 | 22.8 | |
| Growth y/y | -8% | -20% | 18% | -26% | ||
| OPEX | ||||||
| Cost of revenues | -15.9 | -15.4 | -3% | -18.6 | -14.2 | |
| % of sales | -12% | -11% | -15% | -12% | ||
| Other external costs | -29.7 | -32.6 | 10% | -31.2 | -28.5 | |
| Y/Y Growth (%) | -5% | 4% | 40% | 28% | ||
| Personnel expenses | -69.2 | -72.3 | 4% | -73.7 | -65.3 | |
| Y/Y Growth (%) | -6% | -2% | 34% | 19% | ||
| Earnings | ||||||
| EBIT | 17.2 | 17.3 | 0% | 5.7 | 11.6 | |
| EBIT Margin (%) | 12.5% | 12.7% | 4.5% | 9.4% | ||
| Diluted EPS | 0.25 | 0.34 | 39% | 0.09 | 0.16 |
ARR: Negative Effect from FX, Underlying Number Slightly Below Expectations
The total ARR (S&M and SaaS) was SEK405m (369m), down from SEK409m in the last quarter. While the q/q growth is negative, note that FX negatively affected SEK12m q/q. The total FX-adjusted ACV was SEK9.2, somewhat below our forecast of SEK11.0m.
The gross ACV was impressive once again and amounted to SEK20m, following several new deals in Public SE, and 23 and five Dynamics and banking Lasernet deals, respectively. While five banking deals is a strong number, the number of large ones was somewhat lower than usual. On the other hand, the churn was also higher than usual at SEK-10m.
As mentioned in our Update, we also get the impression that management has a more positive outlook for Private ACV relative to the number seen in the quarter, which is not weak but probably below the potential growth level. Also, management sees potential to strengthen the Lasernet offering and allow for more of a land- and expand-strategy. Today, Lasernet has a strong value proposition, especially to large high-end customers, and management aims to increase its attractiveness to a broader group of potential customers. However, those initiatives are in an early stage, and we do not expect any impact on ARR figures in the short term.
While Public SE had a rather strong Q4 with a total ACV of SEK3.4m, Public DK added a net of just SEK0.2m in ACV. Despite our data (focusing on new tenders) suggesting a rather weak Q4 in Public SE, Formpipe did well.
By the start of 2024, Formpipe merged Public SE and DK into one public segment. Management sees many advantages of the merger, such as size, synergies, and focus, and highlights that the business logic is the same across national borders.

Source: Formpipe

Source: Formpipe
The ARR, both S&M and SaaS, and its growth rate (ACV) is the most important metric to follow in Formpipe. The ARR is a leading indicator of recurring revenue growth, the major driver of profit growth in Formpipe and essential to the investment case.
Sales: Matching Our Forecasts
Total sales matched our forecast of SEK138m and amounted to SEK137m (129), corresponding to 7% growth y/y. As expected, the y/y growth was mainly driven by S&M and SaaS, following the strong ARR growth (ACV) in recent quarters. Recurring revenue, S&M and SaaS grew by 20% y/y, slightly better than our expectations. Deliveries came in somewhat short due to Public SE and DK, while the largely negligible Licenses beat our expectations.
Total Deliveries declined y/y by 6%. Deliveries in the private sector are coming down as Formpipe wants partners to take care of the delivery in the private segment, and, thus, that is nothing we are worried about. The decline in Private was roughly as we had anticipated. Management expects the Deliveries in Private to decline somewhat slowly going forward as even more implementation is passed on to partners.
For Sweden, Deliveries was down by 14% y/y while we forecasted an increase of 5%. However, management believes the organization is in good shape and is pleased with the improvements in structure and efficiency. While we do not expect any substantial sales growth in H1 2024, we believe Deliveries Sweden has solid growth potential going forward – as Formpipe takes its consulting in-house.
Public DK suffered from revenue in the Landburgsstyrelsen moving from Deliveries to S&M. However, we believe the level seen in Q4 is likely a bottom, and we expect slight sequential increases as the new deal structure matures.

Source: Formpipe
Formpipe has four kinds of sales: Support & Maintenance (S&M), SaaS, Licenses and Deliveries. Support & Maintenance relates to service agreements for software sold as an on-premises license and SaaS add-on modules where the platform was initially sold as an on-premises license. The Support & Maintenance revenue is 100% recurring and largely resembles SaaS revenue with high gross margins. SaaS revenue is 100% recurring software revenue from software sold as a subscription with high gross margins. Licenses constitute on-premises licenses, and their share of total sales is low and declining. Deliveries is revenue from consulting or professional service with lower gross margins, where Formpipe integrates and sometimes customizes the software.
OPEX: Slightly Above Expectations
Overall, OPEX came in above our forecast of SEK99m and was SEK105m (105), as both Other external costs and Personnel expenses per employee was higher than we expected. However, the number of employees decreased by four q/q while we expected a net addition of four, which, naturally, all else being equal, lowers our OPEX forecasts. Despite OPEX coming in somewhat above our expectations, Formpipe continues to execute on its plan of growing recurring revenues at limited cost increases.

Source: Formpipe
Sales expenses relate mainly to partner kickbacks and sub-consultants. In addition to the typical Other costs, like rent, software and travel, the line includes Formpipe’s Ukrainian-based offshore resources.
Profit and Cash Flow: Further Improvements y/y
EBIT was SEK17.3m (5.7), corresponding to an adjusted EBIT margin of 12.7% (4.5). Our forecast was SEK17.2m and 12.5%. EBITDA - CAPEX was SEK15.2m (10.0), corresponding to an EBITDA - CAPEX margin of 11.2% (7.8), below our forecast of SEK21.3m. While high capitalizations of R&D boosted EBIT in the quarter, and the underlying EBITDA – CAPEX was lower than anticipated, both improved substantially y/y. We expect the increase in capitalized R&D to be temporary. The increase was related to the productization of the work connected to the issues with TAS last year and some additional investments in Lasernet.
By the end of the quarter, Formpipe’s net debt was SEK-2m, and the board proposed a dividend of SEK0.50 (0.00) per share.

Source: Formpipe
As for any SaaS business capitalizing R&D, EBITDA and EBITDA margin are unsuitable metrics for Formpipe. This, as EBITDA discards a large portion of the company’s R&D costs totally. R&D is typically a high cost for most SaaS businesses. Instead, EBIT (where the capitalized R&D is amortized over time) or EBITDA – capitalized R&D/EBITDA – capex are better measures of the underlying profitability as it concerns the company’s full R&D spend.
Estimate Revisions: Slight EBIT Cuts
We lowered our sales forecasts by 3-4% for 2024-2025, which, combined with roughly flat OPEX, resulted in a 4-9% reduction of our EBIT forecasts for 2024-2025.
Notable changes:
- We lower our expectations on Deliveries somewhat. The slight cut is related to us expecting somewhat lower Deliveries from Public SE and DK.
- FX, along with the slightly lower ACV than expected in the quarter, have a negative impact on SaaS and S&M revenue.
We increase our forecasts regarding SaaS ACV somewhat due to management’s statement of higher activity in the Private market – having a positive effect primarily in 2025 and beyond.
| Estimate Revisions | ||||||
| Sales | FYE 2024 | Old | Change | FYE 2025 | Old | Change |
| Net Sales | 546.8 | 568.6 | -4% | 606.6 | 622.5 | -3% |
| Y/Y Growth (%) | 4% | 8% | 11% | 9% | ||
| Support & Maintenance | 248.0 | 259.1 | -4% | 253.1 | 265.1 | -5% |
| Growth y/y | -2% | 3% | 2% | 2% | ||
| ARR (S&M) | 250.6 | 262.1 | -4% | 255.6 | 268.1 | -5% |
| ACV (S&M) | 5.0 | 6.0 | -17% | 5.0 | 6.0 | -17% |
| SaaS | 170.2 | 172.8 | -1% | 213.6 | 214.7 | -1% |
| Growth y/y | 31% | 33% | 25% | 24% | ||
| ARR (SaaS) | 199.6 | 201.4 | -1% | 239.6 | 239.4 | 0% |
| ACV (SaaS) | 40.0 | 38.0 | 5% | 40.0 | 38.0 | 5% |
| Licenses | 13.0 | 12.9 | 1% | 12.7 | 12.6 | 1% |
| Growth y/y | -31% | -27% | -2% | -2% | ||
| Deliveries | 115.6 | 123.9 | -7% | 127.2 | 130.1 | -2% |
| Growth y/y | -6% | -3% | 10% | 5% | ||
| OPEX | ||||||
| Cost of revenues | -61.8 | -65.4 | -6% | -68.5 | -71.6 | -4% |
| % of sales | 11% | 12% | 11% | 12% | ||
| Other external costs | -120.6 | -118.9 | 1% | -125.8 | -124.0 | 2% |
| Y/Y Growth (%) | 1% | 2% | 4% | 4% | ||
| Personnel expenses | -272.8 | -278.9 | -2% | -285.8 | -293.2 | -3% |
| Y/Y Growth (%) | -5% | -2% | 5% | 5% | ||
| Earnings | ||||||
| EBIT | 80.0 | 87.7 | -9% | 116.6 | 121.0 | -4% |
| EBIT Margin (%) | 14.6% | 15.4% | 19.2% | 19.4% | ||
| Diluted EPS | 1.16 | 1.26 | -8% | 1.70 | 1.75 | -3% |
| Forecasts | |||||||||
| Sales | FYA 2023 | Q1E 2024 | Q2E 2024 | Q3E 2024 | Q4E 2024 | FYE 2024 | FYE 2025 | FYE 2026 | FYE 2027 |
| Net Sales | 525.2 | 132.6 | 136.3 | 133.9 | 143.9 | 546.8 | 606.6 | 657.2 | 703.2 |
| Y/Y Growth (%) | 8% | 4% | -1% | 8% | 6% | 4% | 11% | 8% | 7% |
| Support & Maintenance | 252.8 | 61.5 | 61.8 | 62.2 | 62.5 | 248.0 | 253.1 | 258.1 | 263.1 |
| Growth y/y | 12% | 2% | -1% | -5% | -4% | -2% | 2% | 2% | 2% |
| ARR (S&M) | 245.6 | 246.6 | 248.1 | 249.1 | 250.6 | 250.6 | 255.6 | 260.6 | 265.6 |
| ACV (S&M) | 2.5 | 1.0 | 1.5 | 1.0 | 1.5 | 5.0 | 5.0 | 5.0 | 5.0 |
| SaaS | 130.0 | 39.3 | 41.2 | 43.7 | 46.2 | 170.2 | 213.6 | 252.9 | 289.9 |
| Growth y/y | 39% | 40% | 28% | 30% | 28% | 31% | 25% | 18% | 15% |
| ARR (SaaS) | 159.6 | 169.6 | 179.6 | 189.6 | 199.6 | 199.6 | 239.6 | 277.6 | 312.6 |
| ACV (SaaS) | 36.6 | 10.0 | 10.0 | 10.0 | 10.0 | 40.0 | 40.0 | 38.0 | 35.0 |
| Licenses | 18.8 | 2.8 | 3.6 | 2.2 | 4.4 | 13.0 | 12.7 | 12.7 | 12.7 |
| Growth y/y | 13% | 0% | -55% | 15% | -28% | -31% | -2% | 0% | 0% |
| Deliveries | 123.6 | 29.0 | 29.7 | 25.9 | 30.9 | 115.6 | 127.2 | 133.5 | 137.5 |
| Growth y/y | -17% | -21% | -15% | 14% | 6% | -6% | 10% | 5% | 3% |
| OPEX | |||||||||
| Cost of revenues | -61.9 | -15.0 | -15.4 | -15.1 | -16.3 | -61.8 | -68.5 | -74.3 | -79.5 |
| % of sales | -12% | -11% | -11% | -11% | -11% | -11% | -11% | -11% | -11% |
| Other external costs | -119.2 | -28.5 | -31.1 | -29.1 | -31.9 | -120.6 | -125.8 | -130.0 | -133.7 |
| Y/Y Growth (%) | 2% | 3% | 2% | 2% | -2% | 1% | 4% | 3% | 3% |
| Personnel expenses | -286.3 | -69.5 | -70.0 | -62.3 | -70.9 | -272.8 | -285.8 | -300.7 | -316.2 |
| Y/Y Growth (%) | 1% | -5% | -7% | -5% | -2% | -5% | 5% | 5% | 5% |
| Earnings | |||||||||
| EBITDA ex CAPEX | 55.6 | 18.5 | 18.8 | 24.7 | 23.5 | 85.6 | 115.2 | 138.3 | 158.0 |
| EBITDA ex CAPEX Margin | 10.6% | 13.9% | 13.8% | 18.5% | 16.3% | 15.6% | 19.0% | 21.0% | 22.5% |
| EBIT | 48.8 | 17.0 | 17.3 | 23.4 | 22.3 | 80.0 | 116.6 | 142.2 | 163.2 |
| EBIT Margin (%) | 9.3% | 12.8% | 12.7% | 17.5% | 15.5% | 14.6% | 19.2% | 21.6% | 23.2% |
| Diluted EPS | 0.68 | 0.25 | 0.25 | 0.34 | 0.32 | 1.16 | 1.70 | 2.07 | 2.38 |
Valuation
We leave our Base Case at SEK33 (33) despite somewhat lowering our short- and mid-term forecasts. We believe strong growth in recurring revenue fueled by strong ACV, along with margin expansion, will provide solid profit growth over the next few years.
| Fair Value Range - Assumptions | |||
| Bear Case | Base Case | Bull Case | |
| Value per share, SEK | 19 | 33 | 43 |
| Sales CAGR | |||
| 2024 - 2031 | 3% | 6% | 8% |
| 2031 - 2041 | 0% | 2% | 4% |
| Avg EBIT margin | |||
| 2024 - 2031 | 19% | 23% | 24% |
| 2031 - 2041 | 21% | 24% | 25% |
| Terminal EBIT Margin | 13% | 20% | 22% |
| Terminal growth | 2% | 2% | 2% |
| WACC | 9% | 9% | 9% |
| Source: Redeye Research |
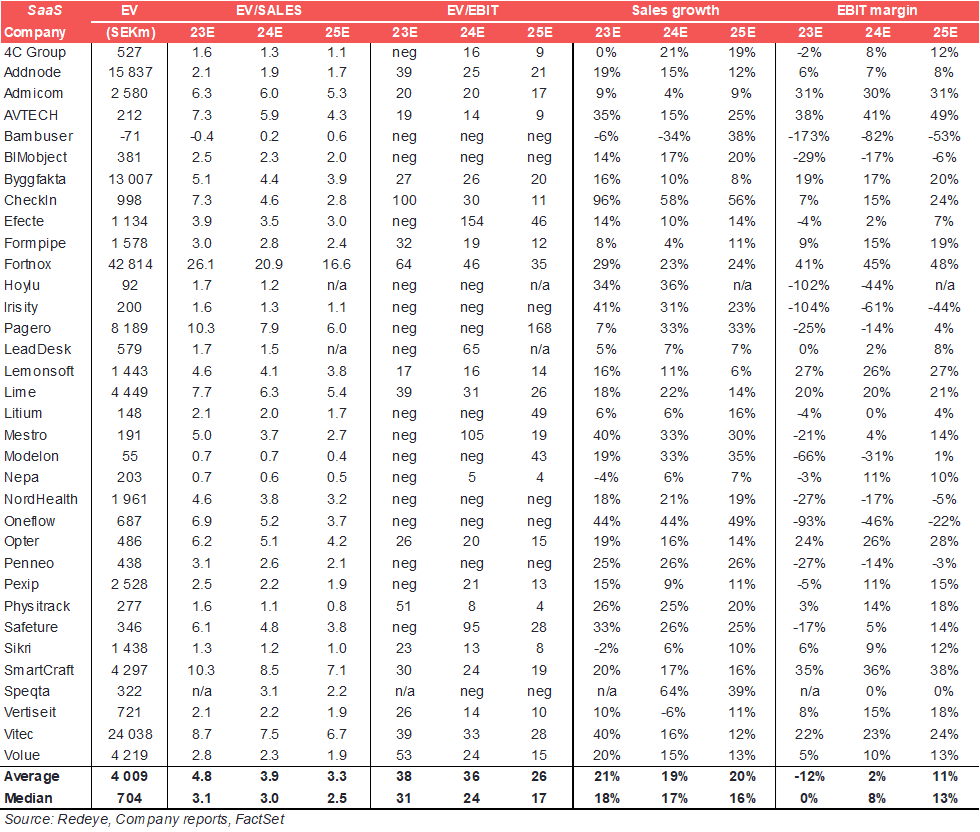
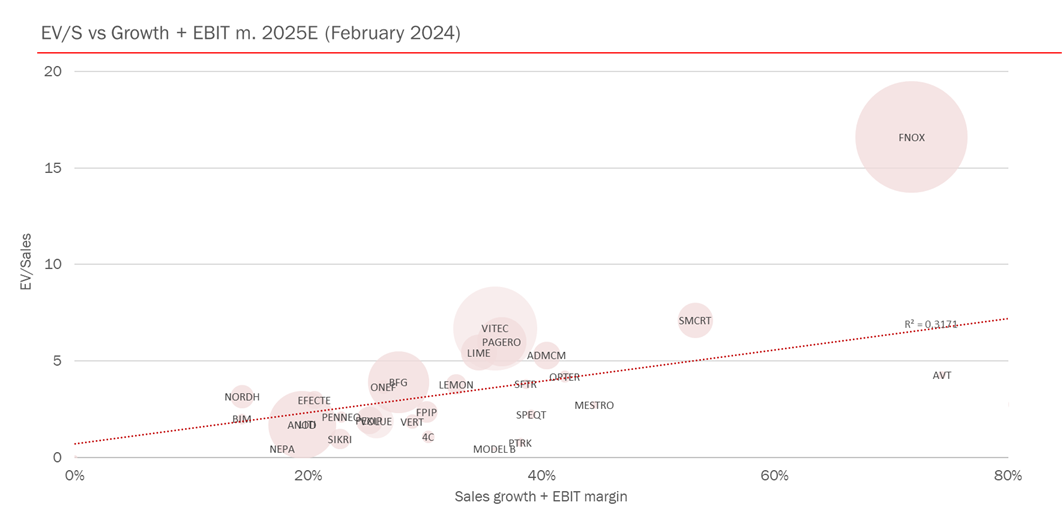
Peer Valuation
WhilWhile Formpipe does not look very attractive on EV/EBIT multiples 2023, as Formpipe focuses on growth, investors should focus on EV/Sales. We believe the combination of a rather low EV/sales, decent sales growth potential, and solid margin expansion potential make Formpipe interesting. The 2025 EV/EBIT of 12x hints at where the expected margin improvement and decent sales growth make with the EV/EBIT valuation. Also, considering that we believe Formpipe can reach an EBIT margin of almost 20% (19.2) in 2025, the 2024e EV/S of 2.7x is arguably attractive given the company reaches our forecasts or its 20% EBIT margin target.
Investment thesis
Case
Margins to Increase as Private Sector Initiatives Pays Off
Evidence
Substantial Improvements in SaaS Growth Suggest Efficient Investments
Challenge
Limited Growth Compared to Average SaaS Business
Challenge
Diversification or Diworsification?
Valuation
Fair Value SEK 33
Quality Rating
People: 4
The new CEO Magnus Svenningson has vast experience in international sales of software as well as working towards both the private and public sectors. Our first impression is that Svenningson seems to fit the needs of Formpipe well, considering his experiences. CFO Joakim Alfredson have relatively high holdings in the firm's stock and most major shareholders are active in the board. The company also has several institutions among its major shareholders.
Business: 4
Formpipe Software's market seems stable with underlying growth. Customers are mainly from the public sector and a big part of revenues are recurring, which creates stability in the business model. Recently, Formpipe has had success with its Lasernet product within the private sector. Unlike the Swedish and Danish public sector, the private sector is global, making the potential much greater.
Financials: 3
Formpipe has non-cyclical recurring revenue streams and a solid financial position. The margins have improved in recent years and are now at robust levels, independent of large License deals. Formpipe is now focusing on growth, and so far, the strategy seems to play out very well.
Financials
Rating definitions
The team
Disclosures and disclaimers
Contents
Review of Q4 2023
ARR: Negative Effect from FX, Underlying Number Slightly Below Expectations
Sales: Matching Our Forecasts
OPEX: Slightly Above Expectations
Profit and Cash Flow: Further Improvements y/y
Estimate Revisions: Slight EBIT Cuts
Valuation
Investment thesis
Quality Rating
Financials
Rating definitions
The team
Download article