Fantasma Games: Continues to gain ground in the US
Research Update
2024-05-10
07:20
Analyst Q&A
Closed
Anton Hoof answered 4 questions.
Redeye updated its estimates after reviewing Fantasma Games’ Q1 report, which came in stronger than expected and showed a record GGR number. With the company facing easier comparables in Q2 and beyond, we anticipate a return to y/y growth in the coming quarter.
AH
HA
Anton Hoof
Hjalmar Ahlberg
Q1 results – Record GGR quarter
After having three consecutive quarters with sales of cSEK8m, Fantasma Games managed to show sequential growth, and net sales amounted to SEK10.1m, a q/q increase of 24% and 10% above our expectations of SEK9.1m. The company continues to do well in the US market, representing 40% of total sales in the quarter, driven by new game launches with FanDuel and BetMGM. GGR reached new records and amounted to SEK151m, up from SEK135m in Q4 and slightly above the previous record of SEK150m, which was set in Q1 2023.
Increased stability
Although GGR is in line with Q1 last year, we believe that the composition is of much higher quality now compared to one year ago. This as 60% of the GGR in Q1 comes from long-tail revenues, a significant increase from approximately 33% in Q1 last year. For example, long-tail revenues have risen from SEK49m in Q1 2023 to SEK91m in the current quarter, providing greater stability moving forward. With the company facing easier comparables in Q2 and beyond, we anticipate a return to y/y growth in the coming quarters.
Valuation and estimate changes
Following the Q1 report, we have made limited revisions to our estimates, increasing sales by 3% for 2024e while leaving sales for 2025e-2026e unchanged. The upward adjustment in 2024e sales is primarily due to higher Q1 sales, with minimal changes for the remaining quarters of the year. We reiterate our base case of SEK70, and the fair value range of SEK20-140. Our base case implies an EV/EBITDA (2025e) multiple of 10x.
Key financials
| SEKm | 2022 | 2023 | 2024e | 2025e | 2026e |
| Net Sales | 31.0 | 35.9 | 48.1 | 56.9 | 66.3 |
| Sales Growth | 299% | 15.9% | 34.1% | 18.1% | 16.5% |
| EBITDA | 5.5 | 7.6 | 15.7 | 23.6 | 31.5 |
| EBIT | -2.1 | -2.2 | 4.7 | 11.1 | 17.6 |
| EBIT Margin | -6.7% | -6.3% | 9.9% | 19.6% | 26.6% |
| Net Income | -3.2 | 2.3 | 3.3 | 8.9 | 14.1 |
| EV/Sales | 4.6 | 3.9 | 3.1 | 2.6 | 2.1 |
| EV/EBITDA | 25.7 | 18.1 | 9.6 | 6.4 | 4.4 |
| EV/EBIT | -67.7 | -61.8 | 31.6 | 13.5 | 7.8 |
First Quarter – Stronger than expected
Fantasma Games’ Q1 report showed stronger sales figures than expected which amounted to SEK10.1m, a decrease of 13% y/y (Q1 2023 was a record quarter for the company) but a growth of 25% q/q. The US continues to be the company’s largest market, representing 40% of total sales in the quarter, up from 27% in Q4. The growth in the region was driven by new game launches with FanDuel and BetMGM. Launch gaming revenue amounted to SEK61m of the total gross gaming revenue (GGR) of SEK151m, while gaming revenues from games older than six months (long-tail gaming revenues) amounted to SEK91m. Long-tail gaming revenues increased 86% y/y, while launch gaming revenues decreased 39% y/y.
Looking at profitability, Fantasma Games reported an EBITDA of SEK2.7m and EBIT of SEK-0.2m, above our estimates of SEK1.5m and SEK-1.2m, respectively. The higher profitability is primarily due to the higher sales, while Opex was roughly in line with expectations.
| Fantasma Games: Forecast deviations | ||||||||
| 0.00 | 0.00 | 0.00 | 0.00 | 0.00 | Actual | Estimate | ||
| SEKm | Q4 22 | Q1 23 | Q2 23 | Q3 23 | Q4 23 | Q1 24 | Q1 24 | Diff (%) |
| Net sales | 10.0 | 11.6 | 8.0 | 8.2 | 8.1 | 10.1 | 9.1 | 10% |
| Growth YoY (%) | 153% | 140% | 7% | -6% | -19% | -13% | -21% | 9pp |
| Gross profit | 8.7 | 9.8 | 6.9 | 6.7 | 6.8 | 8.5 | 7.7 | 9% |
| Gross margin (%) | 87% | 85% | 86% | 82% | 84% | 84% | 85% | -1pp |
| EBITDA | 2.9 | 4.5 | 1.5 | 1.5 | 0.2 | 2.7 | 1.5 | 45% |
| EBITDA (%) | 29% | 39% | 19% | 18% | 2% | 27% | 16% | 10pp |
| D&A | -2.2 | -2.3 | -2.4 | -2.5 | -2.8 | -2.9 | -2.6 | -8% |
| EBIT | 0.7 | 2.3 | -0.9 | -1.0 | -2.6 | -0.2 | -1.2 | 481% |
| EBIT (%) | 7% | 20% | -11% | -12% | -32% | -2% | -13% | 11pp |
| Net finance | -0.2 | -0.1 | 0.0 | 0.2 | 0.4 | -0.4 | 0.0 | n.m. |
| PTP | 0.5 | 2.1 | -0.9 | -0.8 | -2.3 | -0.6 | -1.2 | 90% |
| Net income | 0.2 | 2.1 | -0.9 | -0.9 | 2.4 | -0.7 | -0.9 | 32% |
| Source: Redeye Research |
| Fantasma Games KPIs: Forecast deviations | ||||||||
| 0.00 | #REF! | #REF! | 0.00 | 0.00 | Actuals | Estimate | ||
| SEKm | Q4 22 | Q1 23 | Q2 23 | Q3 23 | Q4 23 | Q1 24 | Q1 24 | Diff |
| GGR | 113 | 150 | 101 | 104 | 135 | 151 | 170 | -13% |
| Net sales / GGR | 8.8% | 7.7% | 8.0% | 7.9% | 6.0% | 6.7% | 5.4% | 1.3pp |
| Source: Redeye Research |
Overall, we think the report is strong, and the company is off to a good start in the new year. Long-tail revenues continue to increase nicely y/y, while launch gaming revenues faced tougher comparables due to the record quarter in Q1 last year. However, compared to Q2-Q4 2023, these revenues also experienced a nice jump, growing by 74% q/q. It is evident that Fantasma continues to benefit from tailwinds in the US, which represents 40% of total sales in the quarter, driven by new game launches with FanDuel and BetMGM. The 40% figure is quite impressive, considering that Fantasma has only launched a limited number of its games in the US market so far. Additionally, we acknowledge that the company shared some other interesting KPIs, such as the number of players surpassing previous records by 20% and one of the quarter’s game launches achieving new records in terms of GGR within the first 30 days of launch.
Once again, the company demonstrates scalability in its business, where the increase in revenues flows smoothly through the P&L, and the company manages to maintain a stable cost base. Despite the cash position being SEK0.9m at the end of Q1, we remain unconcerned about Fantasma’s financial situation, as the cash flow was negatively affected by working capital changes during the quarter. We anticipate a reversal of this working capital effect in the upcoming quarter, along with positive net income, which leads us to expect positive cash flow for Fantasma in the following quarters.

Gross Gaming Revenue
In Q1, the gross gaming revenue (GGR) amounted to SEK151m, in line with Q1 last year but a sequential growth of 12%. This figure is a function of the gaming turnover and gaming margin, revealing how much the operator earns after deducting players' winnings. The gaming margin, in turn, is determined by the return to player (RTP), which is the amount players win relative to their total wagers and can differ between quarters.

The company's gaming revenue (GGR) was split between SEK91m from older games (long tail) and SEK61m from games launched within the last six months (launch gaming revenues). The former grew 86% y/y while decreasing 9% q/q, while the latter declined 39% y/y but increased by 74% q/q. Overall, long-tail revenues continue to have a solid performance, and as these revenues are more sticky, they could also be seen as recurring revenues, giving Fantasma stability in the times ahead.


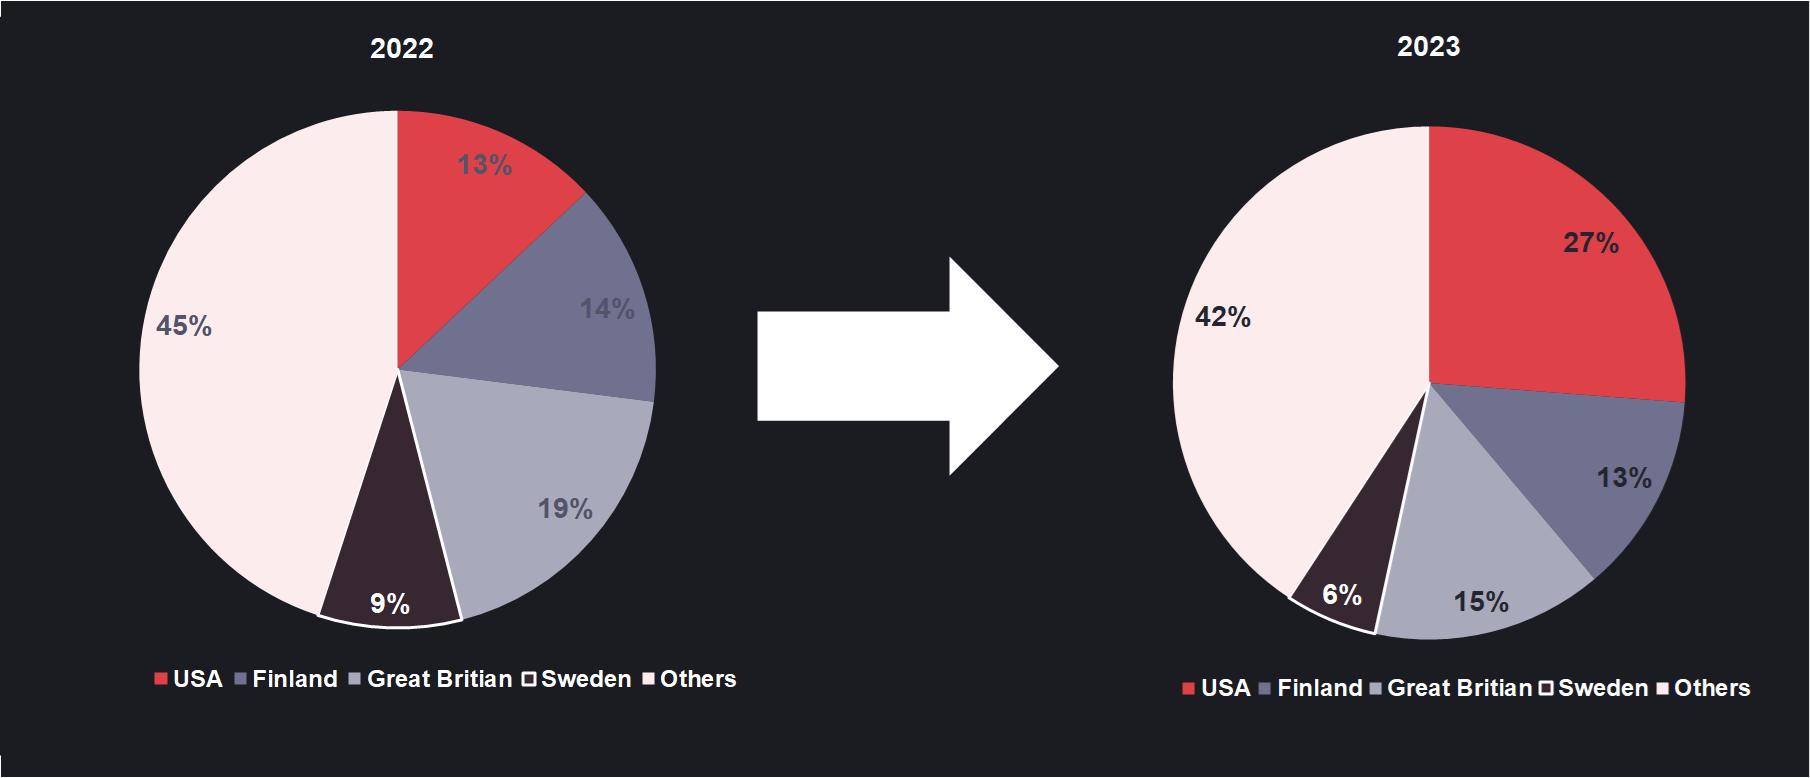
Diversified geographical split
When comparing the revenue split per region from 2022 to 2023, it is evident that the USA has become an increasingly important part of Fantasma’s business, whereas the region stood for almost one-third of the revenues in 2023 (and 40% in Q1 2024), up from 13% in 2022. This also explains why revenues have increased slower than GGR, given the higher tax rate in the US market. Looking ahead, we think the US can become an even bigger part of the company’s total revenues, while we also expect ”Others” to take a larger share due to solid growth prospects in the southern European markets and South America. The company highlights markets such as Italy, Portugal, the Netherlands, Brazil, Colombia, and Mexico. In total, we deem that Fantasma is diversified in terms of the geographical split.

Estimate Changes
Following the Q1 report, we have made limited revisions to our estimates, increasing sales by 3% for 2024e while leaving sales for 2025e-2026e unchanged. The upward adjustment in 2024e sales is primarily due to higher Q1 sales, with minimal changes for the remaining quarters of the year. As for costs, we are also maintaining our estimates for 2024e-2026e, as costs came in as expected for the quarter. We anticipate Fantasma returning to positive EBIT in Q2 2024.
| Estimate revisions | ||||||||||||
| New estimates | Old estimates | Difference % | ||||||||||
| 2024e | 2025e | 2026e | 2024e | 2025e | 2026e | 2024e | 2025e | 2026e | ||||
| Net Sales | 48.1 | 56.9 | 66.3 | 46.7 | 56.9 | 66.3 | 3% | 0% | 0% | |||
| Growth | 34% | 18% | 17% | 30% | 22% | 17% | 4pp | -4pp | 0pp | |||
| Work for own use | 11.5 | 13.1 | 15.2 | 10.7 | 13.1 | 15.2 | 7% | 0% | 0% | |||
| Other income | 0.0 | 0.0 | 0.0 | 0.0 | 0.0 | 0.0 | 0% | 0% | 0% | |||
| Total revenues | 59.6 | 69.9 | 81.5 | 57.4 | 69.9 | 81.5 | 4% | 0% | 0% | |||
| Cost of services sold | -7.5 | -8.0 | -8.0 | -7.0 | -8.0 | -8.0 | 7% | 0% | 0% | |||
| Other external costs | -14.2 | -15.3 | -16.6 | -13.9 | -15.3 | -16.6 | 3% | 0% | 0% | |||
| Personnel costs | -22.0 | -22.7 | -25.2 | -21.6 | -22.7 | -25.2 | 1% | 0% | 0% | |||
| Other operating costs | -0.2 | -0.2 | -0.3 | -0.3 | -0.4 | -0.5 | -36% | -38% | -38% | |||
| Total Opex | -43.9 | -46.3 | -50.0 | -42.8 | -46.4 | -50.2 | 2% | 0% | 0% | |||
| EBITDA | 15.7 | 23.6 | 31.5 | 14.6 | 23.5 | 31.3 | 8% | 1% | 1% | |||
| EBITDA (%) | 33% | 42% | 48% | 31% | 41% | 47% | 1pp | 0pp | 0pp | |||
| D&A | -11.0 | -12.5 | -13.9 | -10.1 | -12.5 | -13.9 | 8% | 0% | 0% | |||
| EBIT | 4.7 | 11.1 | 17.6 | 4.5 | 11.0 | 17.4 | 6% | 1% | 1% | |||
| EBIT (%) | 10% | 20% | 27% | 10% | 19% | 26% | 0pp | 0pp | 0pp | |||
| Net income | 3.3 | 8.9 | 14.1 | 3.6 | 8.8 | 13.9 | -9% | 1% | 1% | |||
| Source: Redeye Research |
Financial Forecast
| Income Statement | ||||||||||
| SEKm | 2022 | 2023 | Q1 2024 | Q2 2024e | Q3 2024e | Q4 2024e | 2024e | 2025e | 2026e | |
| Net Sales | 31.0 | 35.9 | 10.1 | 11.7 | 12.8 | 13.6 | 48.1 | 56.9 | 66.3 | |
| Work for own use | 7.5 | 14.0 | 2.7 | 2.7 | 2.9 | 3.1 | 11.5 | 13.1 | 15.2 | |
| Other income | 0.1 | 0.3 | 0.1 | 0.0 | 0.0 | 0.0 | 0.0 | 0.0 | 0.0 | |
| Total Operating Income | 38.6 | 50.2 | 12.9 | 14.3 | 15.7 | 16.7 | 59.6 | 69.9 | 81.5 | |
| Cost of services sold | -4.4 | -5.7 | -1.6 | -1.8 | -2.0 | -2.1 | -7.5 | -8.0 | -8.0 | |
| Other external costs | -9.1 | -15.9 | -3.2 | -3.6 | -3.6 | -3.8 | -14.2 | -15.3 | -16.6 | |
| Personnel costs | -19.3 | -20.6 | -5.4 | -5.5 | -5.4 | -5.7 | -22.0 | -22.7 | -25.2 | |
| D&A | -7.6 | -9.9 | -2.9 | -2.7 | -2.7 | -2.7 | -11.0 | -12.5 | -13.9 | |
| Other operating costs | -0.2 | -0.3 | 0.0 | -0.1 | -0.1 | -0.1 | -0.2 | -0.2 | -0.3 | |
| Total Opex | -40.7 | -52.5 | -13.1 | -13.6 | -13.7 | -14.4 | -54.9 | -58.8 | -63.9 | |
| Operating Profit | -2.1 | -2.3 | -0.2 | 0.7 | 2.0 | 2.3 | 4.7 | 11.1 | 17.6 | |
| Financial expenses | -0.8 | 0.0 | -0.4 | 0.0 | 0.0 | 0.0 | -0.4 | 0.0 | 0.0 | |
| Profit before tax | -2.9 | -2.2 | -0.6 | 0.7 | 2.0 | 2.3 | 4.3 | 11.1 | 17.6 | |
| Tax | -0.2 | 4.5 | -0.1 | -0.1 | -0.4 | -0.5 | -1.1 | -2.2 | -3.5 | |
| Net Profit | -3.2 | 2.3 | -0.7 | 0.6 | 1.6 | 1.8 | 3.3 | 8.9 | 14.1 | |
| Growth % | ||||||||||
| Net Sales y/y | 299% | 16% | -13% | 45% | 56% | 68% | 34% | 18% | 17% | |
| Net Sales q/q | 0% | 0% | 0% | 0% | 0% | 0% | 0% | 0% | 0% | |
| Margins % | ||||||||||
| EBITDA Margin | 18% | 21% | 27% | 29% | 37% | 37% | 33% | 42% | 48% | |
| EBIT Margin | -7% | -6% | -2% | 6% | 16% | 17% | 10% | 20% | 27% | |
| Net margin | -10% | 6% | -7% | 5% | 13% | 14% | 7% | 16% | 21% | |
| Source: Redeye Research |
Valuation
We have used a WACC of 12% in all scenarios, derived from Redeye’s Rating model, and a tax rate of 20.6%. The discount analysis extends to 2038, and the key financial assumptions for the scenarios are summarized below.
| Assumptions, fair value range | |||||
| Bear Case | Base case | Bull Case | |||
| Value per share, SEK | 20 | 70 | 140 | ||
| Sales CAGR 2024-2028 | 8% | 17% | 26% | ||
| Total Sales 2028, SEKm | 58 | 90 | 135 | ||
| Avg EBIT margin 2024-2038 | 21% | 30% | 37% | ||
| Terminal EBIT Margin | 30% | 40% | 45% | ||
| WACC | 12.0% | 12.0% | 12.0% | ||
| Terminal growth | 2% | 2% | 2% | ||
| Source: Redeye Research |
Bear Case:
In our bear case, we anticipate a sharp decline in top-line growth due to poor performance of new games. This lower growth trajectory also negatively affects scalability, resulting in a lower terminal EBIT margin of 30%.
Base Case:
Our Base Case assumes that Fantasma Games will continue to gain traction in the market, supported by its scalable business model, which should enable the company to achieve higher margins. While we expect rapid growth in the coming years, we remain relatively conservative in our estimates of the company’s long-term EBIT margin as we expect a terminal EBIT margin of 40%, below many successful peers.
Bull Case:
In our Bull Case, we anticipate a longer growth runway and improved scalability, resulting in a terminal EBIT margin of 45% for the company. We have not factored in any exceptional impact from a single slot game, and we believe the bullish scenario is achievable as long as the company continues to gain traction with prominent operators in the industry.
Investment thesis
Case
An emerging growth story
Evidence
Increased traction and scalability starting to be visible
Challenge
Brief history
Challenge
Regulation and competition
Valuation
We see a healthy upside from current levels
Quality Rating
People: 3
The company’s CEO, Fredrik Johansson, is one of the co-founders and owns approximately 15% of the outstanding shares in Fantasma Games. This is encouraging as this aligns his interests with shareholders’. He and the board of directors also have relevant and long experience within the igaming industry, some of them having held key positions in companies like LeoVegas, ComeOn, Kindred, and Light & Wonder. Fantasma has only been listed since 2021, and so we would need more history to see how the management team executes its strategy before lifting our People rating.
Business: 2
Fantasma operates in a highly profitable and competitive market where the barriers to entry are relatively low. The company’s business model is repeatable and scalable, creating recurring revenues and high incremental margins. However, given the lack of moats, it is hard to determine long-term market shares and to forecast how long the company can stay competitive for. The igaming market is also exposed to political risk, increasing the overall business risk.
Financials: 2
While Fantasma has experienced losses historically and lacks financial history, its P&L demonstrates high growth and scalability, suggesting promising financial characteristics in the years ahead. Nevertheless, to achieve a higher score in Redeye's model, the company must provide additional financial data for several more quarters to demonstrate its financial capabilities.
Financials
| Income statement | |||||
| SEKm | 2022 | 2023 | 2024e | 2025e | 2026e |
| Revenues | 38.6 | 50.2 | 59.6 | 69.9 | 81.5 |
| Cost of Revenue | 4.4 | 5.7 | 7.5 | 8.0 | 8.0 |
| Operating Expenses | 21.1 | 22.5 | 24.9 | 25.3 | 26.8 |
| EBITDA | 5.5 | 7.6 | 15.7 | 23.6 | 31.5 |
| Depreciation | 0.00 | 0.00 | 0.00 | 0.00 | 0.00 |
| Amortizations | 8.3 | 9.9 | 11.0 | 12.5 | 13.9 |
| EBIT | -2.1 | -2.2 | 4.7 | 11.1 | 17.6 |
| Shares in Associates | 0.00 | 0.00 | 0.00 | 0.00 | 0.00 |
| Interest Expenses | 0.85 | -0.03 | 0.41 | 0.00 | 0.00 |
| Net Financial Items | -0.84 | 0.03 | -0.41 | 0.00 | 0.00 |
| EBT | -2.9 | -2.2 | 4.3 | 11.1 | 17.6 |
| Income Tax Expenses | 0.25 | -4.5 | 1.1 | 2.2 | 3.5 |
| Net Income | -3.2 | 2.3 | 3.3 | 8.9 | 14.1 |
| Balance sheet | |||||
| Assets | |||||
| Non-current assets | |||||
| SEKm | 2022 | 2023 | 2024e | 2025e | 2026e |
| Property, Plant and Equipment (Net) | 0.04 | 0.02 | 0.02 | 0.02 | 0.02 |
| Goodwill | 0.00 | 0.00 | 0.00 | 0.00 | 0.00 |
| Intangible Assets | 26.5 | 31.1 | 31.6 | 32.2 | 33.5 |
| Right-of-Use Assets | 0.00 | 0.00 | 0.00 | 0.00 | 0.00 |
| Other Non-Current Assets | 0.52 | 6.3 | 6.3 | 6.3 | 0.00 |
| Total Non-Current Assets | 27.1 | 37.4 | 37.9 | 38.5 | 39.8 |
| Current assets | |||||
| SEKm | 2022 | 2023 | 2024e | 2025e | 2026e |
| Inventories | 0.00 | 0.00 | 0.00 | 0.00 | 0.00 |
| Accounts Receivable | 9.9 | 7.2 | 10.6 | 12.5 | 14.6 |
| Other Current Assets | 0.00 | 0.00 | 0.00 | 0.00 | 0.00 |
| Cash Equivalents | 5.8 | 3.5 | 2.7 | 2.8 | 15.1 |
| Total Current Assets | 15.7 | 10.8 | 13.3 | 15.3 | 29.6 |
| Total Assets | 42.8 | 48.2 | 51.2 | 53.7 | 69.4 |
| Equity and Liabilities | |||||
| Equity | |||||
| SEKm | 2022 | 2023 | 2024e | 2025e | 2026e |
| Non Controlling Interest | 0.00 | 0.00 | 0.00 | 0.00 | 0.00 |
| Shareholder's Equity | 28.7 | 31.9 | 35.2 | 44.1 | 58.2 |
| Non-current liabilities | |||||
| SEKm | 2022 | 2023 | 2024e | 2025e | 2026e |
| Long Term Debt | 0.00 | 0.00 | 0.00 | 0.00 | 0.00 |
| Long Term Lease Liabilities | 0.00 | 0.00 | 0.00 | 0.00 | 0.00 |
| Other Non-Current Lease Liabilities | 9.5 | 7.8 | 7.8 | 0.00 | 0.00 |
| Total Non-Current Liabilities | 9.5 | 7.8 | 7.8 | 0.00 | 0.00 |
| Current liabilities | |||||
| SEKm | 2022 | 2023 | 2024e | 2025e | 2026e |
| Short Term Debt | 0.00 | 0.00 | 0.00 | 0.00 | 0.00 |
| Short Term Lease Liabilities | 0.00 | 0.00 | 0.00 | 0.00 | 0.00 |
| Accounts Payable | 0.70 | 0.82 | 0.96 | 1.1 | 1.3 |
| Other Current Liabilities | 3.9 | 7.6 | 7.2 | 8.5 | 9.9 |
| Total Current Liabilities | 4.6 | 8.4 | 8.2 | 9.7 | 11.3 |
| Total Liabilities and Equity | 42.8 | 48.2 | 51.2 | 53.8 | 69.4 |
Rating definitions
The team
Disclosures and disclaimers